
A step closer to faster, more accessible health decision-making
Querying DHIS2 in plain language, finally a reality
What if a health worker, a program focal point, or a decision-maker could simply ask a question in plain language, let’s say “What is the vaccination coverage rate by district this quarter?” and get back a chart, a table, and an interpretation, without writing a single technical query or navigating DHIS2 dashboards?
That’s the promise of the new AI application connected to DHIS2, developed by HISP Rwanda and currently in pilot testing. It joins a growing ecosystem of AI-powered tools for DHIS2 highlighting natural-language analysis apps alongside machine-learning tools for predictive modeling, data entry, and data quality checks. This toll developed by HISP Rwanda brings a new option to that same natural-language-query category, and the first pilot results are a useful early signal of where it stands.
After the first round of structured tests carried out by the technical team, the results are encouraging enough and the lessons learned clear enough to share an initial public update on what the tool can already do, and what the team is still working on.
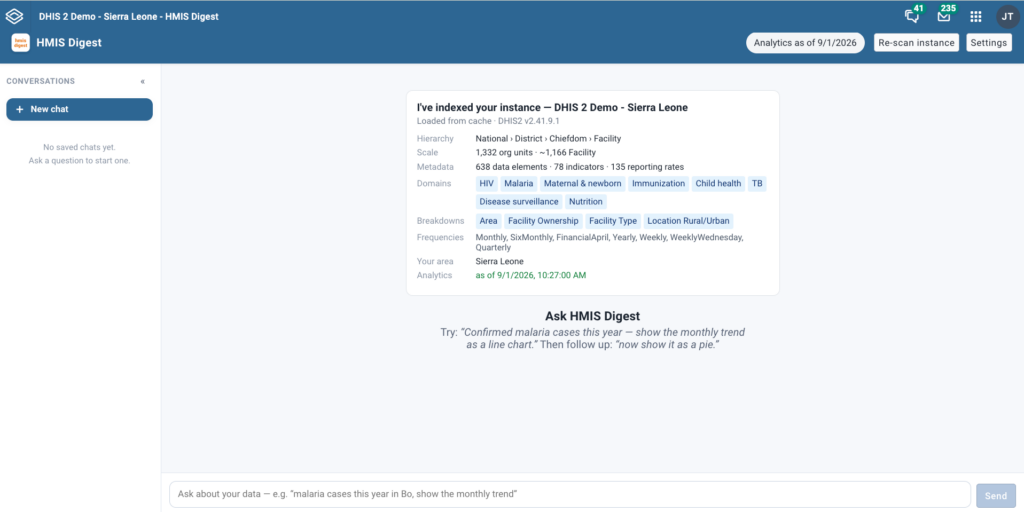
Figure 1. The HMIS Digest home screen – after connecting, the app summarizes the DHIS2 instance (the DHIS2 Sierra Leone demo) and invites a plain-language question.
- Built with data governance in mind
Local model (Ollama) – AI runs within institution’s infrastructure
With the local option, the AI model runs directly on infrastructure controlled by the organization, using Ollama to serve the model. That implies that questions, DHIS2 metadata, and query results remain within the local environment rather than being sent to an external AI provider. This provides a stronger approach to data sovereignty and local control, particularly for health systems handling sensitive information.
Frontier cloud hosted models – data leaves your network
When using a cloud-based model such as gpt or claude AI, questions, relevant DHIS2 metadata, and aggregate query results are sent to the external AI provider to generate a response. Individual patient records are not sent, but aggregate health figures do leave the DHIS2 environment. This approach should therefore be used only where organizational data-governance requirements permit it.
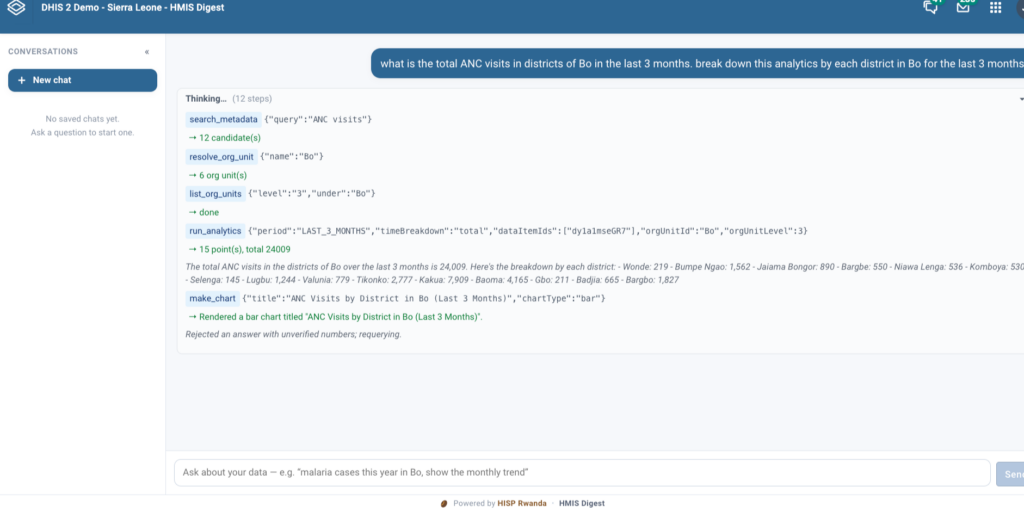
Figure 2. The assistant’s step-by-step reasoning – searching metadata, resolving org units, and running analytics; shown transparently before it answers.
- Let’s look at what the application can already do
The tests, organized around six domains (functionality, accuracy, relevance, visualization, usability, and technical performance), show that the tool’s foundations are solid:
- Reliable connection to DHIS2. The application connects to the tested instance without difficulty, and access was rated “excellent” by testers, no friction to get started.
- Understanding of natural language. Questions asked in everyday language are correctly interpreted by the AI, a capability rated “good” by evaluators whereby the users don’t need to master DHIS2 query syntax to get a result.
- Reliable calculations. Aggregations, percentages, averages, and trends are calculated correctly, which is the essential foundation of any trustworthy public health analysis.
- Relevant interpretations. When the requested indicator is correctly identified, the AI produces a contextualized and useful reading of the data, rated as relevant by testers.
- Intuitive interface. The user experience itself; getting started, navigation was rated “good” giving a promising sign that the tool is designed for non-technical users.
To put it simply: When the question asked closely matches an indicator clearly configured in DHIS2, the application already produces a fast, understandable, and actionable analysis without requiring users to know how to operate the traditional DHIS2 analytics tools.
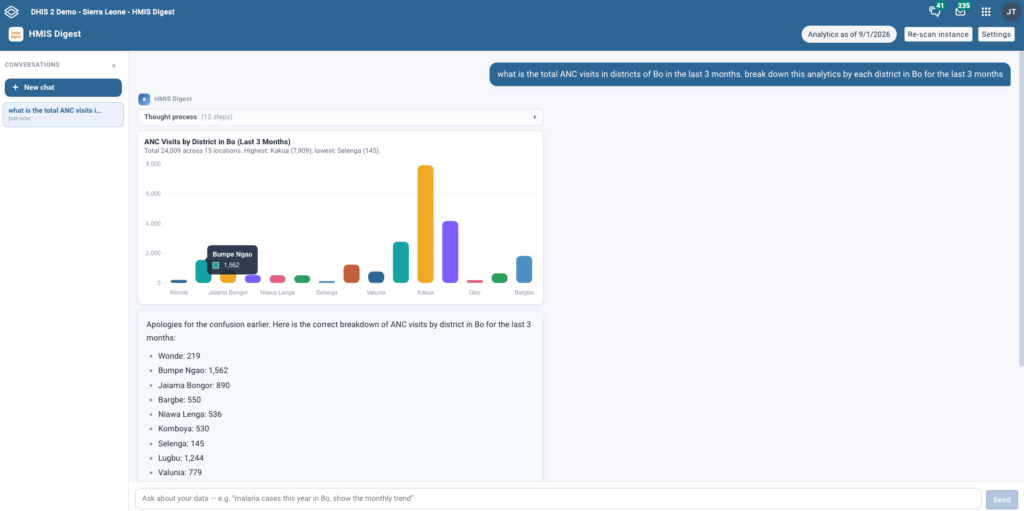
Figure 3. A generated answer – ANC visits by district in Bo, rendered as a bar chart with the supporting breakdown.
3. What the pilot also revealed: A clear roadmap
A pilot test exists precisely to surface what still needs improvement before a wider rollout. The testers’ feedback was direct, and that’s a good thing: it gives the development team a precise roadmap.
Three priority areas of work stand out:
- Strengthen query interpretation. The main friction point identified is that the AI sometimes needs more precise questions to retrieve exactly the right indicator from the DHIS2 database otherwise the generated answer doesn’t fully match the question asked. This is the top priority identified by testers.
- Improve district-level visualization. Some districts don’t consistently appear in the generated charts, and filtering options remain limited, an important point for any sub-national analysis, which is often the main goal for users.
- Reduce response time. The measured latency (around 105 seconds for complex queries to completely respond) was rated unsatisfactory by testers. This is a key area of work so the tool can fit naturally into the daily pace of health teams’ work.
An encouraging overall assessment
When asked about their overall satisfaction, testers rated the application “acceptable” overall, while clearly noting that improvements to the answers provided and to chart display are still needed. That’s exactly the kind of verdict a well-run pilot should produce: neither a premature seal of approval nor a rejection of the tool, but validation of the concept paired with a concrete action plan.
Part of a wider DHIS2 AI movement
This pilot is one piece of a broader push across the DHIS2 community to bring AI into everyday data use. As DHIS2’s own AI overview notes, the platform’s open API and extensible design have already pushed various independent teams to build natural-language and machine-learning tools on top of it, from predictive modeling for climate-sensitive diseases to automated data entry and outlier detection. HISP Rwanda’s application adds to that momentum, and its ongoing testing reflects the same iterative, feedback-driven approach the wider DHIS2 AI community has adopted for tools still in active development.
Next steps
Building on these lessons, exciting work continues on three fronts: strengthening the data-retrieval engine (so every question finds the right DHIS2 indicator), improving the visualization engine (so all districts display correctly, with real filters), and optimizing technical performance (to reduce latency). A new round of testing is planned once these fixes are deployed.
The goal remains unchanged: to put in the hands of every health system stakeholder a data analysis tool as simple to use as a conversation and as reliable as a standard DHIS2 dashboard.
If you want to test the app, you can contact us at contact@hisp.tech
This article is based on the results of a structured test of the AI-DHIS2 application, developed by HISP Rwanda, covering 18 criteria across six domains: functionality, accuracy, relevance, visualization, usability, and technical performance.